If image/table data extraction is corrupted during parsing: A complete guide from merged cells to multi-level headers
“The table was definitely extracted, but the AI keeps answering with numbers from a different quarter.” “As soon as merged cells are involved, the values come out shifted by one cell.”
Tables are one of the most classic yet effective ways to visualize the relationship between items and values—namely, key-value data—and they are also one of the most commonly used formats in documents. In fact, according to a study that analyzed Google Search query datasets, 25.6% of user questions required answers based on data stored in table form. In other words, about one quarter of the questions a RAG system receives require values inside tables or comparative reasoning across rows and columns.
If you have tried table data extraction, there is a situation you likely encounter often. All the text appears to have been extracted, so it looks like a success, but the actual answers are inaccurate. This is because when a standard PDF parser merges rows and columns and breaks the relationships between data, the resulting structural loss carries through to the subsequent retrieval and answer-generation stages.
In this article, we diagnose the causes of broken tables by type—merged cells, multi-level headers, and nested tables—and summarize the principles of restoring row/column relationships with TSR (Table Structure Recognition).
Why table structure loss reduces RAG accuracy
If you extracted a table and the text came out but the AI gives irrelevant answers, the cause is usually table structure loss. If, during the parsing stage, the relationship between the table title and the data is damaged, the AI will struggle to distinguish what a number refers to even when it reads the same value.
A table is a grid where rows and columns intersect, and a cell value has meaning only when it is linked to the header above or beside it. The number “1,200” reveals what it means only when it is attached to a header such as “Q1 2026 revenue.” However, general text extractors do not recognize this grid and simply read cells from top to bottom and left to right. As a result, the row/column relationships disappear, and the linkage between titles and numbers is lost as well.
This structural loss directly affects RAG’s retrieval accuracy and answer quality. RAG (Retrieval-Augmented Generation) is an approach that retrieves relevant content from documents and uses it as evidence for LLM answers. If a table is stored with its structure damaged, the retrieval stage will pull the wrong cell values. As noted in NVIDIA technical materials on RAG document-processing pipelines, when a standard PDF parser merges rows and columns and breaks relationships between data, the next stage produces results that are difficult to trust.
*Source: NVIDIA Technical Blog, “How to Build a Document Processing Pipeline for RAG with Nemotron”, 2026
Why table parsing breaks: merged cells, multi-level headers, and nested tables
The most common causes of broken table parsing are merged cells, multi-level headers, and nested tables. Even if a table looks neatly organized, the relationships between rows and columns can easily become distorted during extraction.
With a simple table, reading from top to bottom and left to right usually does not cause major issues. However, when cells are merged, headers are split across two or more lines, or a table contains another table, the situation changes. Because text extractors do not understand these structures as table relationships and read only in character order, the linkage between headers and values is easily broken.
Why values become misaligned with merged cells
| 2026 | |||
| Q1 | Q2 | Q3 | Q4 |
| 1,200 | 1,350 | 1,500 | 1,420 |
Values become misaligned with merged cells because the extractor reads a merged cell only once. If we assume the “2026” cell merges four columns from Q1 to Q4, the extraction result shows “2026” only once, making it impossible to tell which quarter the numbers below belong to.
If, as in the table above, “2026” appears only once and the remaining values continue in sequence, the “Q1 revenue” header will be linked not to its original value, 1,200, but to the next value, 1,350. If this table is fed into RAG, even when a user asks for “Q1 2026 revenue,” the AI may actually return 1,350, which is the Q2 value.
This issue is not a limitation of a single tool. Even in an official issue on the Python data analysis library Pandas, a problem was reported where header-to-column linkage breaks when extracting merged cells (rowspan/colspan). This serves as a reference case showing that the process of restoring merged-cell structures into machine-readable row/column relationships is inherently challenging.
Source: pandas github, “ENH: read_html to handle rowspan, colspan (GitHub Issue #17054)”
Column names that disappear with multi-level headers
Column names disappear with multi-level headers because the extractor assumes the header is a single row. If you extract a two-level header table where the upper header “2025 / 2026” sits above the lower header “H1 / H2,” the values are listed without distinguishing which row is the column name and which row is data.
| 2025 | 2026 | ||
|---|---|---|---|
| H1 | H2 | H1 | H2 |
| 980 | 1,040 | 1,200 | 1,310 |
When the header spans two or more rows, either the upper or lower header may be omitted during extraction, or the header may be mixed into the body numbers as if it were data.
For example, during extraction the table above may come out as a single line such as “2025 2026 H1 H2 H1 H2 980 1,040 1,200 1,310.” From the extractor’s perspective, there is no criterion to determine where the header ends, so the hierarchy disappears and all values are listed at the same level.
This is why conditions that require combining upper and lower headers—such as “H2 2026”—are particularly problematic. When the hierarchy is damaged, the AI loses the basis for linking the two and may retrieve the year and half-year separately and answer with an incorrectly combined value. The fact that one-directional reading and independent cell handling can easily miss these hierarchical relationships is also pointed out as a limitation of existing approaches in TSR research on multi-level header processing.
*Source: Arxiv, “Multi-Cell Decoder and Mutual Learning for Table Structure and Character Recognition”, 2024
Coordinate information lost with nested tables
Coordinate information is lost with nested tables because the coordinates of the inner table overlap with those of the outer table. If a cell in a table contains another small table, the inner table’s cells can encroach on the outer table’s coordinates in the extracted result (JSON), causing the overall row/column indices to become misaligned.
| Category | Performance | |
|---|---|---|
| Q1 | Target | 1,200 |
| Achieved | 1,180 | |
| Q2 | Target | 1,350 |
| Achieved | 1,400 | |
A parser assigns coordinates sequentially to the outer grid. When it encounters a new table inside a cell, the inner table also needs its own coordinates. If there is no criterion to distinguish the outer and inner tables, the two coordinate systems overlap at the same indices. From that point on, all subsequent cell coordinates become misaligned, and in the RAG retrieval stage, when searching for a specific figure, it may pull a different value from an adjacent cell.
In RobusTabNet research on table structure restoration, it is noted that TSR must precisely restore cell boundaries and coordinates, and that the more complex and distorted the table, the higher the difficulty.
Ultimately, these three causes converge on one point: an extractor that does not understand structure reads a grid-based table sequentially. In that case, the solution is to restore the grid structure before reading the text. However, for images or scanned documents, there is an additional step—so we will look at that first.
Source: Arxiv, “Robust Table Detection and Structure Recognition from Heterogeneous Document Images” (RobusTabNet), 2022
Why extracting tables from images and scanned documents is more difficult
In digital documents (e.g., a PDF created digitally), text is stored as text data and can be extracted directly. However, in scanned documents or photos, text is an image made of pixels, so it must first be read with OCR before it can be converted into text. For this reason, table extraction from digital documents is already challenging, but image/scanned documents make it even more difficult.
If scan quality is low, characters may be misrecognized (e.g., 8 as B), and in number-heavy tables, even a single wrong character can throw off the entire value. If a typed form is mixed with handwriting, or handwritten annotations are overlaid on a table, you must first determine what is the table and what is the text region before reading the characters.
Want to take a deeper look at OCR, the core technology behind table data extraction?
👉 What is OCR? From core AI OCR technologies to a guide for document automation use cases
How processing differs between digital tables and tables in images
The difference in how digital tables and tables in images are processed depends on how the text is stored. For digital documents with a text layer, direct text extraction is sufficient, but pages with low text density or text that exists only as an image require OCR. Therefore, before batch processing, it is more efficient to first determine whether a page is image-based and select only the pages that require OCR.
| Category | Tables in digital documents | Tables in image/scanned documents |
| How text is stored | Text data | Pixel image |
| Extraction method | Direct text extraction | Extract after OCR text recognition |
| Key factors affecting accuracy | TSR accuracy | Scan resolution/clarity + TSR |
| Recommended processing | Parsing + TSR | Apply OCR + DLA + TSR together |
Because image/scanned documents add the additional variable of scan quality, they require both OCR to recognize text and technologies to restore structure.
How low-quality scans and OCR noise lead to data errors
The process by which low-quality scans lead to data errors begins at the text recognition stage. When scan quality is low, character shapes blur and OCR may misrecognize or omit parts of the text. In number-heavy tables, these misrecognitions immediately become data errors.
OCR is a technology that converts text in images, scans, and image-based PDFs into machine-readable text. Documents where text exists only as an image must go through OCR to become data.
Noise introduced at this stage carries through to the subsequent stages. According to the OHRBench study on how OCR noise affects RAG, the more imperfect the OCR is, the more RAG performance degrades in measurable ways. Errors caused by misread text reduce the accuracy of retrieval and generation results. Therefore, in image document processing, reducing noise and improving recognition accuracy is just as important as restoring table structure.
*Source: IBM, “What Is Optical Character Recognition (OCR)?”
*Source: Arxiv, “OCR Hinders RAG” (OHRBench), 2024
How TSR restores tables
TSR is a technology that finds a table’s row/column/cell boundaries in a document and restores the relationships that determine which header each cell belongs to. Because it restores the grid structure and reads text based on it, it can maintain the linkage between headers and values even when merged cells or multi-level headers are present.
To restore a damaged table, you must first find the table region in the document and then restore the row/column relationships within the table. DLA (Document Layout Analysis) identifies the table region, and TSR restores the cell boundaries and row/column relationships within that region. Generally, TSR is performed after DLA, and the two technologies serve different roles.
Identify the table region with DLA
DLA is a technology that recognizes where elements such as text blocks, tables, images, and titles are located on a page. Using AI deep learning, it distinguishes document components and identifies their positions and relationships.
Because the region “from here to here is the table” must be defined before restoring row/column relationships, DLA becomes the first step in handling tables. In other words, DLA is responsible for “finding where the table is,” while TSR is responsible for “restoring the row/column relationships within the table.”
Restore row/column relationships with TSR
TSR identifies cell boundaries and row/column coordinates within a table and restores the linkage that connects each value to its corresponding header. Once DLA finds the table region on the page, TSR structures merged cells, multi-level headers, and relationships between cells within that region.
In image or scanned documents, OCR first recognizes the text, and TSR then organizes it according to the restored row/column structure. With this approach, data is not extracted as a simple sequence of characters; instead, it is extracted in a form that preserves header-value relationships, such as “Q1 2026 revenue.”
As a result, TSR does not flatten a damaged table into plain text; it converts it into structured data with row/column relationships intact. Only when this structure is preserved can the subsequent RAG retrieval stage search numbers together with their corresponding items and use them as more accurate evidence for answers.
Convert to structured data and connect to RAG
Tables restored with TSR are output as structured data with row/column relationships preserved. Rather than listing cell values as plain text, it organizes them in a way that retains the linkage between headers and values, making them easier to use in subsequent RAG processes.
A RAG process typically proceeds in the order: document extraction → parsing → chunking → embedding → vector DB storage → retrieval → answer generation. When data with table structure intact is stored, the retrieval stage can find items and numbers together, and the AI can answer based on more accurate cell values.
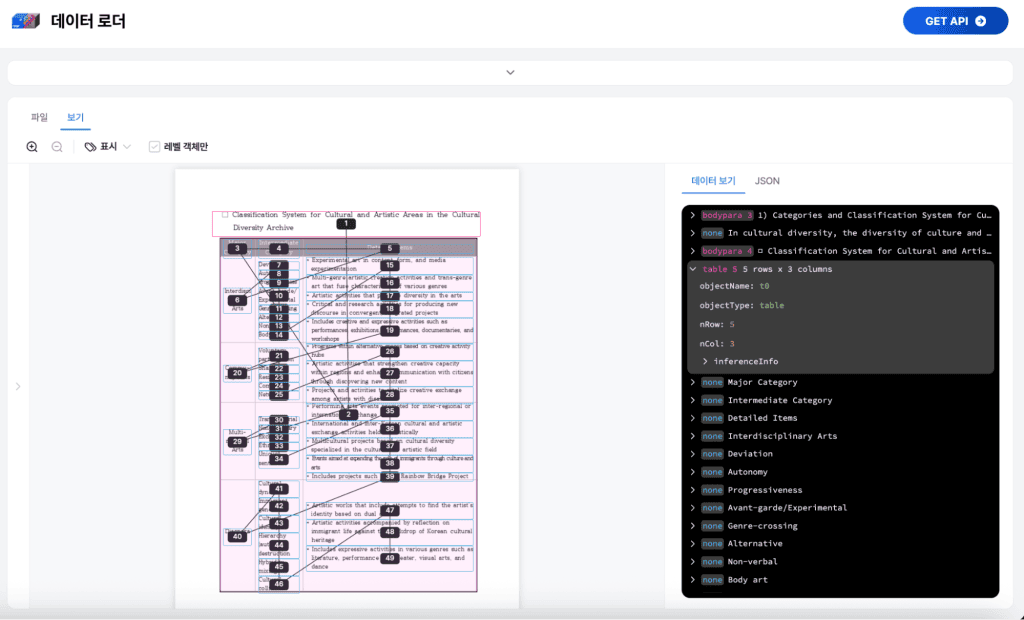
If you would like to see how TSR results differ in practice, you can upload a document and check directly in the Hancom Data Loader live demo.
👉 Go to the Hancom Data Loader live demo
How Hancom Data Loader handles table parsing
Hancom Data Loader is a document parsing solution that converts HWP, HWPX, PDF, and OOXML documents into structured data that AI can use.
Depending on the document type, it applies OCR, DLA, and TSR to extract components such as text, tables, and images. In particular, it converts tables that include merged cells and multi-level headers into structured data while preserving row/column relationships, reducing the risk of table data being damaged during the RAG preprocessing stage.
Technologies applied for table data extraction by format
How tables are handled differs by document format. In some documents, text is stored as text data; in others, it remains only as an image; and in cases like HWP/HWPX, accurate extraction requires reading the original document structure directly. Therefore, rather than applying a single technology, table data extraction requires a combined approach—direct parsing of the source, OCR, DLA, and TSR—depending on the document type.
The key point is that you do not need to stitch these technologies together separately. If you combine OCR, DLA, and TSR as separate tools, errors can occur at integration points and the operational burden can increase. Hancom Data Loader bundles extraction functions suited to each document type into a single pipeline, reducing handoff points and instability in the table data extraction process.
Table data extraction in practice: a customer case
A representative real-world case of table data extraction is the Gyeonggi Provincial Office of Education’s AI digital platform project. As the first initiative of its kind among Korea’s 17 provincial/metropolitan offices of education, Hancom supplied its in-house AI solution to the selected LG CNS consortium, and Hancom Data Loader was responsible for preprocessing public documents into AI-trainable formats.
According to a Digital Daily report, Hancom Data Loader converts data from approximately 2,800 school websites, around 40,000 guidance materials, and about 7,000 guidelines and legal/regulatory documents into AI-trainable formats and integrates them with Hancompedia. Hancom Data Loader handles extraction and parsing, while Hancompedia—its in-house RAG solution—handles chunking the organized data and connecting it to question answering.
You can also choose an adoption model that fits your environment. The Hancom Data Loader API is billed per page, so you can get started by paying only for the volume you actually process rather than committing to a bundled subscription. If you want to verify table data extraction quality first, you can evaluate it by using only what you need.
👉 Explore the Hancom Data Loader API
FAQ: Frequently asked questions about extracting text from image tables
Why does data become misaligned when extracting a table with merged cells?
Because the text extractor reads a merged cell only once, values are pulled forward by the number of cells assumed to be empty, breaking the linkage between headers and values. An official Pandas issue (#17054) also reported header-to-column linkage breaking with merged cells (rowspan/colspan).
How is TSR different from general text extraction?
VLM is a multimodal AI that processes both images and text, while LLM is a model that processes only text. The key difference is that VLM incorporates a vision encoder to accept images and interpret visual information.
Can tables in scanned documents also be extracted accurately?
Hancom Data Loader supports a pipeline that converts visual information into text descriptions through VLM-based image and chart captioning. ※ The Image Captioning feature is currently in the PoC stage, and the commercial release schedule will be announced later.
References
- NVIDIA Technical Blog, “How to Build a Document Processing Pipeline for RAG with Nemotron”, 2026
- NVIDIA Technical Blog, “Approaches to PDF Data Extraction for Information Retrieval”, 2025
- pandas, “ENH: read_html to handle rowspan, colspan (GitHub Issue #17054)”
- Arxiv, Kawakatsu, “Multi-Cell Decoder and Mutual Learning for Table Structure and Character Recognition”, 2024
- Arxiv, Ma et al., “Robust Table Detection and Structure Recognition from Heterogeneous Document Images” (RobusTabNet), 2022